Daksha Bhasker, CISSP attended the new critical infrastructure track at RSAC2025, where sessions focused on both the technical and economic impacts of disruption as well as protecting essential networks, services and supply chains from cyberattacks.
Disclaimer: The views and opinions expressed in this article belong solely to the author and do not necessarily reflect those of ISC2.
 Critical infrastructure (CI) may be defined as “The physical structures, facilities, networks and other assets which provide services that are essential to the social and economic functioning of a community or society.” CI attacks can have a substantial impact on public safety, with knock-on impacts that ripple through other CI sectors due to deeply intertwined supply chains. For instance, energy sector disruptions can impact transportation, which in turn affects the food supply chain. For 2025, the RSA conference introduced a new track on CI, with a focus on how we can protect CI from cyberattacks.
Historically, risk calculations of cascading CI impacts have been established by intuition, by the likes of emergency managers. At the conference, we explored research work conducted by Tyson Macaulay in affiliation with Carleton University into critical infrastructure interdependence (CII). It offers tools to leverage cyber connectivity along with economic indicators for forecasting cascading impacts across industries.
While supply chains in CI can be global, the first notable issue is that nations around the world define CI differently, per this example:
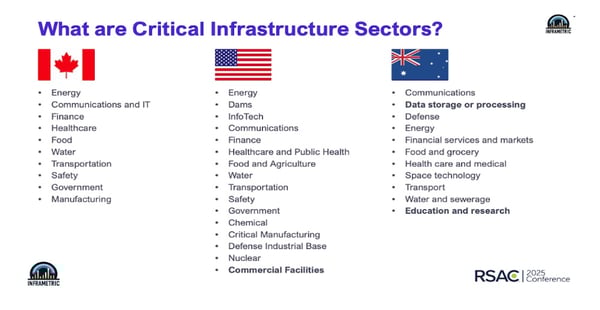
As such, during a crisis, different nations will prioritize the protection of different national industries and assets. Additionally, certain CI sectors have limited engagement in risk management or are completely missing from the table.
During the conference track, a methodology to arrive at metrics to substantiate CII risk management decisions was provided and discussed.
Metrics is the Name of the Game
Since there is no single metric for CII, the challenge is to find the right indicators that demonstrate the relationship between different CI sectors in the industry. The research arrived at a compound metric, leveraging the following:
- Qualitative Cyber-Metrics: These are newer data samples collected over 15 years based on sensitivity scores from subject matter experts, on a) the confidentiality, b) the integrity, and c) the availability of information arriving from other CI sectors. By way of illustration: to what extent does finance depend on or assess the sensitivity of information arriving from the food sector or government?
- Quantitative Econometrics: These are based on levels of spending, buying and selling, between sectors in the supply chain. These datasets are open source, typically published by government sources, such as the Bureau of Economic Analysis in the U.S. and Stats Canada in Canada.
Then, a correlation coefficient is established between cyber-metrics and econometrics by CI sectors. For example: the energy sector shows a moderate-to-strong correlation of .65. Qualitative metrics can be used to bolster the quantitative buy-sell values to stabilize the CI indicators.
Manitoba CI Pipeline Shutdown
In the spring of 2024, a fuel pipeline running north into Manitoba (Canada) experienced an emergency maintenance shut down, disrupting the energy industry. Simultaneously a wastewater main in Winnipeg ruptured releasing 4 billion liters of untreated water into the Assiniboine River. The CII econometrics model was tested for predictions, to forecast which sectors the cascading impacts of two concurrent CI (energy and wastewater) failures would impact.
The model showed that the CIs, food, government and safety, and transportation industry had the most cascading impacts, in that order (from energy and wastewater disruptions). These predictions corresponded with the actual impact reported in the province, indicating that the model is an effective indicator of CII supply-chain impacts.
U.S. to Canada to U.S. – The CII Boomerang Effect
This case study is perhaps the most pertinent use case, with cross-border trade currently subject to scrutiny and/or tariffs.
A quarter (25%) of Ontario’s computer system design and related services are effectively imported from the U.S., including AWS, Microsoft 365, Oracle and other cloud-based solutions. Following the money (the econometric model) suggests that a large part of these services are consumed by the following CI sectors in descending order of magnitude:
- Computer Systems Design
- Banking and Finance
- Municipal Governments
- Provincial Government
- Federal Government Services
- Architectural Engineering-related Services
As a technology hub, Ontario exports to other Canadian provinces. Following the money with the CII econometric model shows that the impact cascades from the Ontario business hub into the Alberta energy hub (banking, oil and gas, architectural engineering sectors). In turn, the impacts cascade back into the U.S., largely impacting the petroleum, oil and gas industries there, as the figure shows:
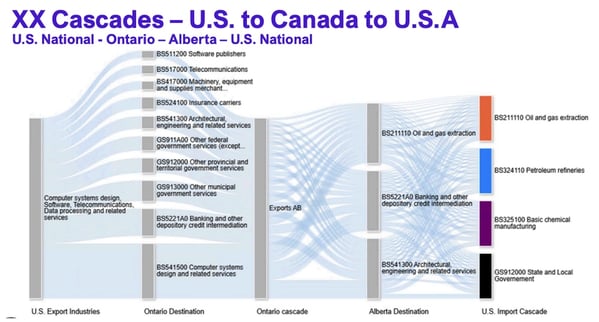
The identification and quantification of such a “boomerang effect” is invaluable insight for supply chain risk management. Having a data-based CII tool allows emergency managers and risk officers to move away from intuitive speculation, instead facilitating metrics-based predictions.
For those involved in the management of critical infrastructure, this model enables a step-up in protection for critical infrastructure supply chain interdependence, enabling a better understanding of impacts and, consequently, better associated risk management.
Daksha Bhasker, CISSP, has over 20 years of experience in the telecommunications service provider, software and finance sectors. Daksha has held security architecture roles for complex solutions, security systems development across carrier grade systems for voice, video, data and security.
Related Insights